
From AI Boom to Market Gloom: Understanding the Options Market Fragility
From AI Boom to Market Gloom: Understanding the Options Market Fragility
The AI-Driven Bull Market Faces Tail Risks Amid the Options Market Structure

From AI Boom to Market Gloom: Understanding the Options Market Fragility
I want to start by expressing my firm conviction in the bull market driven by the AI revolution. I anticipate that AI has the potential to lead to an unprecedented stock market boom, eventually becoming the most giant bubble in history.
However, the present upward market action is building on fragile foundations resulting from the current structure of the options market. Essentially, the stock market's steady rise since October 2022 reached a point where it now goes hand in hand with investors’ substantial exposure to downside tail risk, providing almost no room for error.
Tail Wagging the Dog
Equity options have grown explosively in recent years, and the notional amount of the derivatives market has become larger than the stock market. According to GS, in March 2024, options volume surpassed share volume in US single stocks for the first time since 2021, making it critical to monitor flows in the options market when trading stocks. Because of this, everybody has been talking about the “tail wagging the dog”, a phrase often used when options trading influences the underlying asset’s price, rather than the traditional view where the underlying asset's price influences the options.
Chart 1

Source: Goldman Sachs
The high levels of options activity can often lead to wild stock market swings via the so-called “Gamma squeezes”. Those are scenarios where the stock price rapidly increases or decreases as the underwritten options exacerbate the moves. To understand a Gamma squeeze, it's essential to first know about delta and Gamma, two of the "Greeks" used in options trading. Delta measures how much an option's price changes in response to a $1 change in the underlying stock's price. Gamma measures how much the delta changes in response to a $1 change in the stock's price.
How a Gamma squeeze happens:
· When a stock experiences significant buying activity, its price begins to rise.
· If the stock has a large number of call options (which give the holder the right to buy the stock at a set price), the entities that sold these call options (often market makers or institutional traders) need to hedge their positions as the stock price approaches the strike price of these options. They do this by buying the underlying stock to cover their potential obligation, known as "delta hedging."
· The closer the stock price gets to the call options' strike price (or moves past it), the more the market makers need to buy the stock to stay delta-neutral, leading to a further increase in its price.
· This increase in stock price causes the delta of the options to increase, and since the Gamma is high, this leads to a rapid increase in delta, requiring even more buying of the stock for hedging. This cycle can cause the stock's price to rise exponentially quickly, hence the term "squeeze."
These mechanics can also be applied in reverse with put options if market conditions allow (reverse Gamma squeeze):
· Initial Setup: Let's assume the stock of Company XYZ is currently trading at $100. Many traders believe that XYZ's stock price will decrease significantly soon, so they start buying put options with a strike price of $95.
· Market Makers and Delta Hedging: Market makers who have sold these put options need to hedge their risk. Initially, if XYZ's stock price remains above $95, the delta of these put options is negative but close to zero, meaning the options' value won't change much for small price movements of the stock. However, as the stock price begins to drop closer to the $95 strike price, the absolute value of delta increases (delta becomes more negative), indicating that the put options' value will increase more significantly for each dollar drop in XYZ’s stock price.
· Hedging and Stock Selling: Market makers sell XYZ stock to hedge their positions. This selling can push the stock price down further. When XYZ’s stock price falls below $95, the delta of the put options becomes even more negative, leading to more aggressive selling by the market makers to stay delta-neutral.
· The Squeeze: This selling pressure can lead to a drop in XYZ’s stock price, making the put options more in-the-money (ITM), increasing their deltas further (more negative), and causing more selling. If there is enough momentum and volume, this can exacerbate the downward pressure on the stock price, creating a reverse Gamma squeeze.
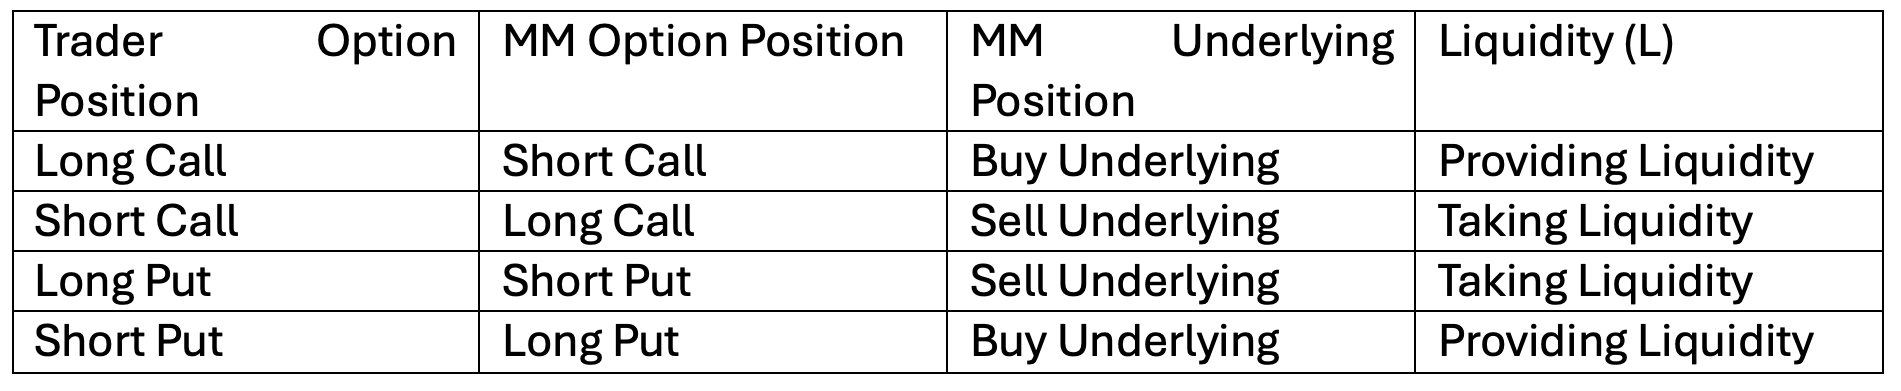
In an environment dominated by options trading, the net positioning of options significantly influences the liquidity of the stocks underlying these options. This happens because market makers, who provide the other side of the trade, avoid taking directional bets and always aim to maintain a delta-neutral position. Market makers are indifferent to the stock's fundamental values or technical analysis; their actions are solely based on their hedging needs. For example, even if a stock has dropped 50% and has a price-to-earnings ratio of 1, market makers will keep selling it to hedge their positions if traders increase their long put options. Conversely, even if a stock's price has surged 100-fold within a year and it boasts a price-to-earnings ratio of 500, market makers will continue purchasing the stock to hedge if traders increase their long call options, thus injecting liquidity into the market.
Table 1
Aggregating every option contract across the S&P 500, the Gamma exposure of the whole index through time looks like this:
Chart 2
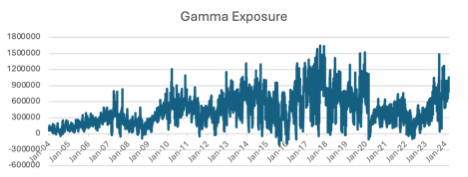
Source: SqueezeMetrics
As observed, the Gamma exposure is typically positive, indicating that market makers (MMs) add liquidity to the market. With positive gamma, during market pullbacks, MMs purchase the lows and sell the highs. Conversely, in the less common scenario where Gamma exposure is negative, dealers hold a short Gamma position, thereby consuming liquidity and creating instability in the market. In these situations, MMs sell during market downturns and buy during upswings, intensifying the market movements.
Besides the Gamma factor on liquidity, there is also a “Vanna” effect. Specifically, Vanna measures the rate of change in the delta of an option with respect to changes in the implied volatility (IV) of the underlying asset. In simpler terms, it shows how the directional exposure of an option (delta) changes as the market's expectations of volatility (implied volatility) change. Here is how the MMs buy (provide liquidity) or sell (demand liquidity) the underlying when IV moves:
Table 2

Aggregating every option contract across the S&P 500, the Vanna exposure of the S&P index through time looks like this:
Chart 3

Source: SqueezeMetrics
According to SqueezeMetrics, positive Vanna flows into the market have reached record levels recently (exceeded $500mn daily). But we will return to this chart in a while.
Picking up Silver Coins on Thin Ice
Short volatility strategies have been gathering steam in recent years. Banks use those strategies to construct structured products and then sell those to investors. Shorting volatility is an investment approach that yields consistent profits, provided that markets stay calm. These strategies typically perform well in stable, range-bound, or slowly progressing markets with little price fluctuation. However, they carry significant risks, especially during market turmoil or when volatility spikes.
Examples of short volatility strategies include selling options (naked or covered), option spreads, iron condors, short straddles or strangles, directly shorting VIX futures/options, etc.
Kris Sidial from Ambrus Capital has recently provided data on the rise of structured products with short volatility exposure. Specifically:
· The net notional short Vega exposure is 2x higher than in January 2018 (right before Volmageddon). Vega is one of the key 'Greeks' in options trading that measures an option's price sensitivity to changes in the underlying asset's volatility. It represents the amount by which the price of an option is expected to change for a 1% change in the implied volatility of the underlying asset.
· U.S equity short volatility hedge funds AUM are 6x larger today compared to January 2018.
· Derivative income funds AUM is about 10x today than in January 2018
Chart 4

Source: Ambrus Capital
· The auto-callable market is about 3x the size when compared to January 2018.
Chart 5

Source: Ambrus Capital
So, nowadays short volatility trade is way bigger than before the Volmageddon in February 2018. Back then, the VIX experienced a dramatic surge, exceeding 50 at one point. Leading up to February 2018, stock markets, particularly in the United States, had been experiencing a prolonged period of low volatility and steady gains. Many investors had become complacent due to the seemingly unending bullish market. This complacency manifested in the popularity of inverse volatility products, financial instruments designed to move in the opposite direction of volatility indices like the VIX. Many investors had been betting against volatility by investing in these products, assuming the market's calm conditions would continue. When volatility spiked suddenly, the value of these inverse products plummeted, forcing massive selloffs and further exacerbating the market's downturn.
But let’s go back to Chart 3. In fact, it reflects the record short volatility positioning, with investors shorting OTM put options (with strike prices below spot), providing a record amount of Vanna flows. Initially, by shorting OTM put options, investors prompt market makers (MMs) to add liquidity, enhancing both Gamma and Vanna exposures (Table 1). If a minor market downturn occurs and the VIX (implied volatility) rises, the positive gamma prompts MMs to purchase the dip. Moreover, due to the Vanna effect, MMs are compelled to buy more of the index, stabilising the market and decreasing the VIX (Table 2).
But suppose the selling pressure keeps up, and the market slips further. In that case, some participants may hit margin calls and be forced to close their short put positions. If those are predominantly still OTM, MMs will sell the underlying, taking liquidity from the market and causing more selling pressure.
Moreover, these puts may shift to being in-the-money (ITM) in a sustained market downturn. In this case, Gamma and Vanna become sources of liquidity demand whenever the VIX increases (Table 2). MMs will then be forced to sell the underlying assets, exacerbating liquidity pressures, especially as investors begin shorting the market to hedge their short put positions. As now everybody scrambles for liquidity, this could result in a rapid and steep market declines. As SqueezeMetrics indicates, the risk of a crash is significantly influenced by the extent of put selling by investors[1].
Conversely, when a market correction occurs, leading to a spike in the VIX, if investors have protected themselves with long OTM put options, MMs initially respond by selling into the downturn. However, if those options move ITM, the rise in VIX prompts MMs to purchase the underlying assets, aiding market stabilisation (Table 2).
Therefore, when investors are safeguarded against tail risks by holding purchased puts, a major sell-off is often prevented, leading to a more controlled and gradual downturn. In contrast, when investors are overconfident and are heavily short on put options, market weaknesses have the potential to escalate rapidly into severe downturns.
Yet, what could trigger a market pullback that would ultimately lead to a crash? Some macro or micro event? Or maybe a combination of both. The list of potential catalysts is countless, and among them are elevated stock valuations, an accelerating inflation that would increase interest rates, an economic recession or stagflation, overdependence on leading stocks, etc.
The Trigger
Given this market setup, where investors are increasingly betting against extreme market movements, the catalyst doesn't need to be a major event like the Global Financial Crisis or the COVID pandemic.
For instance, in August 2015, concerns about China's economic slowdown, its currency devaluation, and anticipation of rising U.S. interest rates led to a 10% drop in the S&P 500 over six trading days, while the VIX leapt from 13 to 53. These factors, though significant, did not constitute global economic disasters.
Similarly, during the February 2018 Volmageddon, the S&P 500 fell by 10%, and the VIX soared from 11 to 50 within nine trading days, primarily due to the dynamics surrounding the popularity of inverse volatility products. These products, which grew significantly in early 2018, were designed to provide the opposite return of 1-month VIX futures on a daily basis. This necessitated that they buy VIX futures when the index rose and sell when it fell, contributing to market distortions when the VIX suddenly increased due to a shortage in VIX futures supply. Yet, no substantial macroeconomic events triggered this upheaval, demonstrating that a significant market downturn and a surge in volatility can occur even without a major economic crisis.
The catalyst I consider most likely to trigger a major stock market sell-off is the current high concentration level. The rally since October 2022 has been significantly driven by a handful of companies – namely Nvidia, Apple, Alphabet, Amazon, Meta, and Microsoft. From October 2022 to March 2024, the total market capitalisation of the S&P 500 increased by $13 trillion, and a staggering 44% of this growth is attributed to these six tech giants alone. By March 2024, their influence had grown even more pronounced, contributing to 54% of the increase in the index's market capitalisation. As of March 19th, the combined market share of these six in the S&P 500 reached 30%, marking the highest concentration level since the 1970s.
The stock market heavy concentration raises concerns because any significant sell-off in these dominant stocks could disproportionately affect the broader market. Their outsized influence means that fluctuations in their stock prices can dramatically sway the overall direction of the S&P 500. This scenario sets a stage where the broader market's stability relies heavily on the performance of just a few entities. Should there be a shift in investor sentiment, or these firms encounter difficulties, the ensuing sell-off could precipitate widespread declines across the market.
Besides the concentration, another risk factor is the extremely rapid, almost verticle market surge. While a vertical market rise can be exhilarating, it is often unsustainable from a technical standpoint as it creates short-term overbought conditions. As more investors pile into the market, the risk of a sharp correction increases as the market becomes more sensitive to shifts in sentiment or external shocks. The same psychological factors fueling a market's vertical ascent – greed and exuberance – can abruptly reverse when investors' expectations change or an unexpected event occurs.
Once the sentiment reverses, the same dynamics that propelled the market upwards can accelerate its fall. Panic selling can ensue, with investors rushing to exit positions and minimise losses. Automated trading systems and stop-loss orders can exacerbate this sell-off, leading to a rapid unwinding of positions. In highly leveraged markets, the decline can be intensified as margin calls on short volatility strategies force investors to sell assets to cover their positions.
Cut off the Dog’s Tail
Given the abovementioned market setup, protecting investment portfolios against extreme market downturns has become increasingly vital. Implementing strategies to hedge against these tail risks is not just advisable; it's imperative in the current market environment. Investors can mitigate the impact of sudden market shifts by preparing for potential sharp declines. This approach ensures portfolios are more resilient against unpredictable events, helping preserve capital in extreme volatility scenarios.
[1] The Implied Order Book: Measuring S&P 500 Liquidity with SPX Options, SqueezeMetrics, July 2020